
Compound interest is interest earned on interest. Each time interest is added to your balance, the next payment is calculated on the larger total, so growth speeds up the longer the money is left alone. For illustration only, £10,000 earning 5% a year grows to about £16,289 after 10 years with compounding, against £15,000 if the interest were paid out each year instead. The same arithmetic applies to investment returns, to charges and inflation that eat into them, and to debts that are left unpaid.
What compound interest is
With simple interest, you earn the same amount every year because interest is calculated only on the money you first put in. With compound interest, each payment is added to the balance and earns interest itself from then on. The gap between the two is small at first and large later.
A savings account is the plainest example. Suppose you deposit £10,000 at an interest rate of 5% a year, for illustration only. After one year you have £10,500 either way.
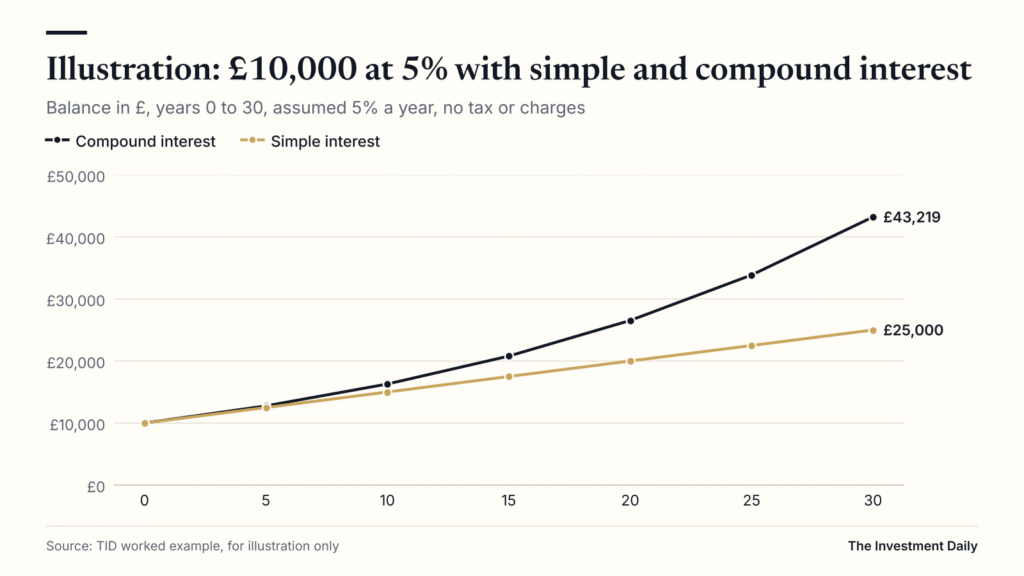
In the second year simple interest pays another £500, while compound interest pays £525, because it is calculated on £10,500. By year 30 the compounded balance is £43,219, against £25,000 with simple interest.
| Years (illustration at 5% a year) | Simple interest balance | Compound interest balance | Difference |
|---|---|---|---|
| 1 | £10,500 | £10,500 | £0 |
| 5 | £12,500 | £12,763 | £263 |
| 10 | £15,000 | £16,289 | £1,289 |
| 20 | £20,000 | £26,533 | £6,533 |
| 30 | £25,000 | £43,219 | £18,219 |
The rate is an assumption chosen to make the sums easy to follow. It is not a forecast. Bank Rate stood at 3.75% at the Bank of England’s last decision, published on 17 September 2026, with the next announcement due on 5 November 2026 (Bank of England). Rates on savings and returns on investments both change over time.
The compound interest formula
The standard formula is A = P × (1 + r/n)^(n × t), which is easier to read written out in words. The final amount A equals the starting sum P, multiplied by one plus the rate per period, raised to the power of the number of periods.
- P is the principal, the sum you start with.
- r is the annual interest rate as a decimal, so 5% is 0.05.
- n is the number of times interest is added each year: 1 for annual, 12 for monthly.
- t is the number of years. The power is n multiplied by t, the total number of periods.
Worked through for £10,000 at 5% compounded once a year for 10 years: 1.05 multiplied by itself ten times is about 1.6289, so A is about £16,289. A spreadsheet does the same job with a formula such as =10000*(1+0.05)^10.
Working backwards from a target
The formula can also be rearranged to find the rate needed to reach a goal. Divide the target by the starting sum, take the root equal to the number of years, and subtract one. For illustration only, turning £10,000 into £20,000 in 15 years needs a compound rate of about 4.73% a year after costs and tax. Tripling it in 20 years needs about 5.65%.
Running the sum this way is a useful check on expectations. If the rate required is well above what cash pays, reaching the target means taking investment risk, saving more or waiting longer. None of these is guaranteed to work, and each has costs.
Adding regular contributions
Most people save in instalments rather than a lump sum. Each payment then compounds for a different length of time.
For illustration only, £200 a month for 20 years, earning 5% a year compounded monthly, builds to about £82,207. You would have paid in £48,000, so about £34,207 is compounded growth. The earliest payments do most of the work, because they compound for longest.
Monthly or annual compounding and the AER
How often interest is added makes a difference, though a smaller one than the rate itself or the time invested. Savings providers show this with the annual equivalent rate. MoneyHelper, the government-backed guidance service, describes the AER as “the total interest you’ll receive on your savings in one year”, shown as a percentage, and says that the higher the AER, the more interest you receive (MoneyHelper). Because it is a one-year total, the AER includes any interest that is added during the year and then earns interest itself, so an account that compounds more than once a year has an AER above its gross rate.
The annual equivalent rate lets you compare accounts that pay interest monthly, quarterly or yearly on the same footing. The gross rate, by contrast, is the contractual rate before compounding within the year is taken into account. The table shows the effect of compounding frequency on a 5% gross rate, for illustration only.
| Interest added | Periods a year | Rate per period | Equivalent annual rate | £10,000 after 1 year |
|---|---|---|---|---|
| Annually | 1 | 5.0000% | 5.00% | £10,500.00 |
| Twice a year | 2 | 2.5000% | 5.06% | £10,506.25 |
| Quarterly | 4 | 1.2500% | 5.09% | £10,509.45 |
| Monthly | 12 | 0.4167% | 5.12% | £10,511.62 |
| Daily | 365 | 0.0137% | 5.13% | £10,512.67 |
Moving from annual to monthly compounding adds about 0.12 percentage points at this rate. Two points follow. First, comparing accounts by the annual equivalent rate rather than the gross rate puts them on the same footing, because the annual equivalent rate already includes compound interest within the year. Second, interest taken out monthly to spend does not compound at all, so the AER overstates what you receive.
Compound returns on investments
Investments do not pay a fixed rate, but the same principle applies to compound returns. If a fund’s dividends are reinvested, or an accumulation share class keeps the income inside the fund, gains build on earlier gains. The difference is that returns vary from year to year and can be negative, so the path is uneven and the end result is unknown in advance.
For a share fund, compound returns come from two sources: changes in the price of the holdings, and the dividends they pay. If the dividends are taken as cash, only the price element compounds. If they are reinvested, they buy more units, which then earn their own dividends and price changes.
Volatility also matters for compound returns. A fall of 20% followed by a rise of 20% does not get you back to where you started: £10,000 becomes £8,000 and then £9,600. An average return quoted as a simple arithmetic average can therefore look better than the compound annual rate an investor actually earned. When a fund reports annualised returns, those are compound returns: the steady yearly rate that would have produced the same end value.
Why time matters most for compound interest
The rate matters, but time matters more, because compound interest does most of its work in the later years. The figures below compare two savers for illustration only, each earning an assumed 5% a year with nothing withdrawn, no tax and no charges.
- Saver A pays in £2,000 at the start of each year from age 25 to 34, a total of £20,000, then stops. At 35 the pot is worth about £26,414. Left to compound until 65, it reaches about £114,158.
- Saver B pays in £2,000 at the start of each year from age 35 to 64, a total of £60,000. At 65 the pot is worth about £139,522.
Saver B ends with more, but has paid in three times as much. Saver A’s £20,000 grew more than fivefold because each payment had 31 to 40 years to compound. Compound returns on investments follow the same pattern, but with returns that vary, so the outcome is uncertain in a way these fixed-rate examples are not.
The lesson is about the shape of the curve, not the particular numbers. In the 5% illustration at the top of this article, the balance rose by £6,289 in the first decade and by £16,686 in the third. Withdrawals, a lower rate, higher charges or a fall in markets late in the period all change the result.

The rule of 72
The rule of 72 is a shortcut for estimating how long money takes to double at a given compound rate. Divide 72 by the annual rate in per cent. At 6% a year, 72 divided by 6 gives 12 years; the exact answer is about 11.9 years. The rule of 72 is most accurate for rates between about 4% and 12%.
| Annual compound rate (illustration) | Rule of 72 estimate | Exact doubling time |
|---|---|---|
| 2% | 36 years | 35.0 years |
| 3% | 24 years | 23.4 years |
| 4% | 18 years | 17.7 years |
| 6% | 12 years | 11.9 years |
| 8% | 9 years | 9.0 years |
| 12% | 6 years | 6.1 years |
The rule of 72 also works in reverse, which is often more useful. Inflation of 3.5% a year halves the buying power of cash in roughly 20 years. Charges compound against you too: for illustration only, charges of 1.5% a year on a pot growing at 6% a year before costs would take away almost half of its growth over 40 years. The next sections put numbers on both.
Real compound interest after inflation
Interest and investment returns are usually quoted in nominal terms: the number of pounds you will have. What matters for spending is the real return, after inflation. The Office for National Statistics reported that the Consumer Prices Index rose by 3.5% in the 12 months to September 2026, up from 3.1% in August; the CPIH measure, which includes owner occupiers’ housing costs, rose by 3.6% (ONS).
The real return is found by dividing rather than subtracting: (1 + nominal rate) divided by (1 + inflation rate), minus one. For illustration only, a 5% return with 3.5% inflation gives a real return of about 1.45% a year, not 1.5%. Real returns compound in the same way as nominal ones, so small differences add up over long periods.
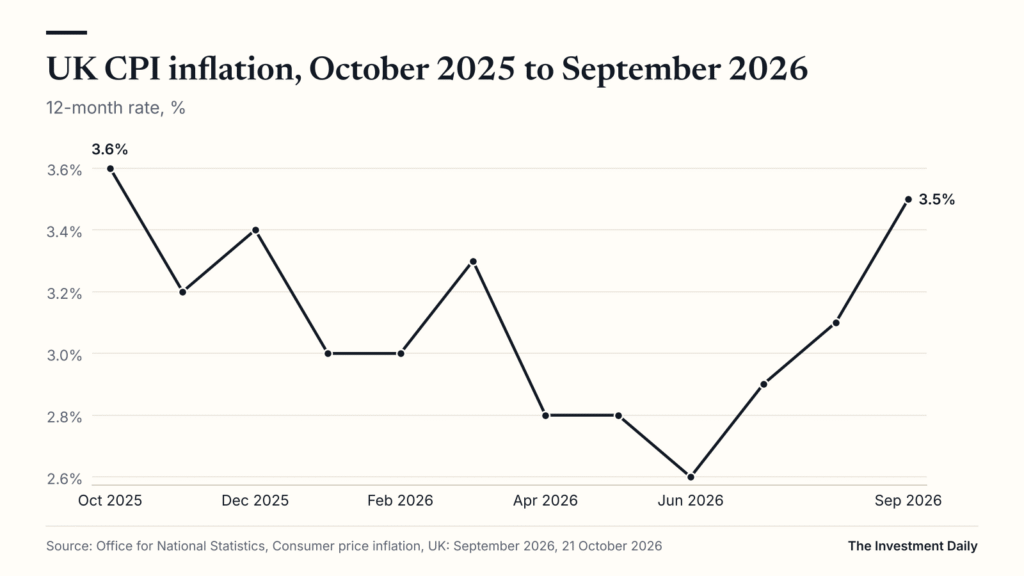
The ONS series shows how inflation has moved over the past year. CPI inflation was 3.6% in October 2025, fell to 2.6% in June 2026 and rose to 3.5% in September 2026 (ONS). If prices rose at 3.5% a year for 10 years, £1,000 of today’s spending would cost about £1,411, and £1,000 held as cash earning nothing would buy only about £709 of today’s goods.
Real returns on cash
Cash can lose value in real terms even when it earns interest. For illustration only, an account paying 3.75%, the level of Bank Rate at the September 2026 decision, against CPI inflation of 3.5% gives real returns of about 0.24% a year before tax (Bank of England; ONS). After tax at 40%, the 3.75% becomes 2.25%, and the real return turns negative at about minus 1.2% a year.
That is why savers and investors look at real returns after tax rather than headline rates. Compound interest at a rate below inflation still compounds, but it compounds a shrinking amount of buying power.
- Compare any interest rate or expected return with the latest CPI figure before judging it.
- Remember that inflation compounds too, and that past inflation does not tell you future inflation.
- For inflation-linked options, see inflation, cash and index-linked gilts.
How charges and tax drag slow compound returns
Charges compound in the same way as returns, but against you. A fund charge is taken every year from a pot that would otherwise have kept growing, so the lost money also loses all its future growth. Over long periods this is often the largest controllable cost in investing.
The table shows £10,000 invested for 25 years at an assumed 6% a year before charges, for illustration only. With no charges it would grow to about £42,919. Each extra 0.5 percentage point or so of annual cost reduces the end value by thousands of pounds.
| Total annual charges (illustration) | Net annual growth | Value after 25 years | Lost to charges |
|---|---|---|---|
| 0% | 6.00% | £42,919 | £0 |
| 0.2% | 5.80% | £40,939 | £1,980 |
| 0.75% | 5.25% | £35,938 | £6,981 |
| 1.5% | 4.50% | £30,054 | £12,865 |
Tax drag on savings interest
Tax drag works the same way. Interest that is taxed each year leaves less to compound. Outside an ISA, the Personal Savings Allowance is £1,000 for basic rate taxpayers and £500 for higher rate taxpayers, and the starting rate for savings is 0% on up to £5,000, according to the Budget 2026 rates annex (HMRC and HMRC). GOV.UK explains that the starting rate is only available if your other taxable income is less than £17,570, and that every £1 of other income above the personal allowance reduces it by £1 (GOV.UK). Additional rate taxpayers have no Personal Savings Allowance.
Budget 2026, delivered on 28 October 2026, raises the tax on savings income from 6 April 2027. The savings basic, higher and additional rates are 20%, 40% and 45% in 2026 to 2027, rising to 24%, 44% and 49% in 2027 to 2028 (Annex A; OOTLAR item 1.1). That increases tax drag on interest above the allowances.
For illustration only, take a higher rate taxpayer who has already used the allowance and holds £50,000 at 4% for 10 years. Untaxed, the balance compounds to about £74,012. Taxed at 40%, the net rate is 2.4% and the balance reaches about £63,383. Taxed at 44%, the higher rate for savings income from 6 April 2027, the net rate is 2.24% and it reaches about £62,399.
Inside an ISA you do not pay tax on interest, income or capital gains, and the adult subscription limit is £20,000 a year (GOV.UK; Annex A). Budget 2026 also confirmed that the cash ISA limit stays at £20,000 for all savers over 18 from April 2027, reversing a planned cut (OOTLAR item 2.5). Dividends outside an ISA have a separate £500 allowance and rates of 10.75%, 35.75% and 39.35% (GOV.UK). See tax-efficient investing in the UK for how the wrappers fit together.
Compound interest on borrowing and the APR
Compound interest works against borrowers in exactly the same way, which is often the more expensive lesson. If you do not repay interest as it is charged, it is added to the debt and itself attracts interest. A loan or card balance left untouched grows along the same curve as a savings account, only faster, because borrowing rates are usually higher than savings rates.
The annual percentage rate is the standard measure. Under the Consumer Credit (Total Charge for Credit) Regulations 2010, the annual percentage rate of charge is calculated by an equation “which equates, on an annual basis, the total present value of drawdowns with the total present value of repayments”, including charges (legislation.gov.uk). In effect it is an annual compound rate that includes fees as well as interest.
For illustration only, an annual percentage rate of 24% on a card balance corresponds to about 1.81% a month, compounded. A £3,000 balance with no repayments and no further spending would grow to about £3,720 after one year and about £5,720 after three years. Minimum payments that barely cover the interest leave the balance compounding for years.
- Compare borrowing by the annual percentage rate, not the monthly rate or the headline interest rate.
- Check how promotional rates end and what rate applies afterwards.
- Money used to repay a debt saves the interest that debt would have charged, so the saving on a balance charged at 24% APR is larger than the interest earned on the same sum in an account paying a lower rate.
Common mistakes with compound interest
The arithmetic is simple, but a few habits stop it working as intended. Most come down to interrupting compound interest or ignoring what reduces it.
- Comparing gross rates. Compare savings by the annual equivalent rate and borrowing by the annual percentage rate.
- Using nominal figures. Plan with real returns, after inflation, especially for goals decades away.
- Withdrawing the interest. Interest taken out to spend does not compound. That may be the right choice for income, but it changes the maths.
- Ignoring inflation. A nominal gain can be a real loss. Check returns against CPI.
- Ignoring charges and tax drag. Small annual costs compound into large sums over decades.
- Assuming a steady rate. Illustrations use fixed rates. Real savings rates change, and investment returns vary and can be negative.
- Starting late. Time is the strongest input. The final years of a long compounding period add the most in pounds.
For a wider view of where to start, see how to start investing in the UK and the foundations section.
Compound interest: the main points
Compound interest turns time into growth: each payment of interest or return adds to the base on which the next is earned. The formula is short, the rule of 72 gives a quick estimate, and the annual equivalent rate shows the effect of compounding within a year. Inflation, charges and tax drag compound too, so real returns, after costs and tax, decide what your money will buy. Compound interest is a tool, not a promise.
For borrowers, compound interest runs the other way, and the annual percentage rate shows its full cost. All the figures in this article are illustrations, not forecasts. Savings rates and investment returns change, investments can fall as well as rise, and past performance is not a guide to future returns. For cash options, see the cash savings desk.