Rental yield is the annual rent a property produces as a percentage of what it cost. Gross yield divides the year’s rent by the price; net yield first deducts running costs such as voids, letting fees, repairs and insurance. On the Office for National Statistics’ figures, the average UK private rent was £1,406 a month in September 2026 and the average house price £273,000 in August 2026 (ONS, 21 October 2026). Neither yield includes mortgage interest, tax or changes in the property’s value, so neither is the same as your return.
This guide shows how to calculate both, which costs to include, how mortgage interest and the property income tax rates from 6 April 2027 change the result, and what ONS data show about rents and prices across England.
What rental yield means
Rental yield is a ratio. It tells you how much income a property generates for each pound it cost, before or after running costs. It lets you compare properties of different prices, and compare property with other income-producing assets, on a like-for-like basis.
There are three versions in common use, and it matters which one someone quotes:
- Gross yield: annual rent divided by the purchase price or current value.
- Net yield: annual rent minus running costs, divided by the price or by the total cost including purchase costs.
- Cash yield, or cash-on-cash return: cash left after costs and mortgage interest, divided by the cash you actually put in.
Advertised figures are almost always gross. They are easy to calculate and always higher than the net figure. A rental yield is also a snapshot: it uses this year’s rent and this year’s price, and both change.
Yield on cost and yield on value
For a property you already own, the yield on what you paid and the yield on what it is worth today can be very different. For illustration only: a house bought for £150,000 that now rents for £11,700 a year yields 7.8% gross on cost. If it is now worth £220,000, the yield on value is 5.3%. The second figure is the more relevant one when comparing with other investments, because £220,000 is the capital tied up in the property now. Rising house prices lower the yield on value even when the rent is unchanged.
How to calculate gross rental yield
The formula is simple: gross yield equals annual rent divided by property price, multiplied by 100. Use the rent you expect over a full year, which is the monthly rent multiplied by 12.
For illustration only: a house bought for £220,000 and let at £975 a month produces £11,700 a year. £11,700 divided by £220,000 is 0.0532, a gross yield of 5.3%. Those figures are close to the ONS averages for the North West, where the average rent was £975 a month in September 2026 and the average house price £220,393 in August 2026 (ONS PIPR dataset; ONS UK HPI dataset).
- Take the monthly rent you can realistically achieve, not the asking rent.
- Multiply by 12 for the annual rent.
- Divide by the purchase price, or by the current value for a property you already own.
- Multiply by 100 to express it as a percentage.
Gross rental yield is a screening tool. It ranks properties quickly but ignores every cost, so two properties with the same gross figure can produce very different incomes.
Net rental yield: the costs to include
Net rental yield deducts the costs of running the let. GOV.UK describes allowable expenses as “things you need to spend money on in the day-to-day running of the property”, with examples such as letting agents’ fees, accountants’ fees and buildings and contents insurance (GOV.UK, paying tax on rental income). For a yield calculation the list should also include the rent you lose when the property is empty.
The main costs
- Voids. Weeks between tenants when no rent comes in. Even a short void of four weeks a year removes nearly 8% of the rent.
- Letting and management fees. Usually a percentage of rent collected, plus fees for finding tenants.
- Repairs and maintenance. Boilers, decorating, gardens, appliances. GOV.UK also describes replacement of domestic items relief for furnishings bought for tenants’ use.
- Insurance. Landlord buildings and contents cover.
- Safety and compliance. Gas safety checks, electrical inspections and energy certificates.
- Licensing. GOV.UK says an HMO “must have a licence if it is occupied by 5 or more people”, and that councils can include other types of HMO in licensing (GOV.UK, HMOs). GOV.UK directs landlords to their council to find out whether a licence is needed.
- Leasehold costs. Service charges and ground rent on flats.
- Accountancy and professional fees.
A worked example
The table continues the hypothetical £220,000 house, for illustration only. The cost figures are assumptions, not market averages.
| Illustration only | Annual amount |
|---|---|
| Rent at £975 a month for 12 months | £11,700 |
| Less 4 weeks’ void | minus £900 |
| Rent collected | £10,800 |
| Management at 12% of rent collected | minus £1,296 |
| Repairs and maintenance | minus £1,000 |
| Insurance | minus £350 |
| Safety certificates and compliance | minus £250 |
| Licensing, averaged per year | minus £150 |
| Accountancy | minus £300 |
| Net rental income before mortgage and tax | £7,454 |
| Gross yield on £220,000 | 5.3% |
| Net yield on £220,000 | 3.4% |
| Net yield on total cost of £234,900 | 3.2% |
The total cost adds stamp duty land tax and £2,000 of legal and survey fees. A buyer who already owns a home pays the higher rates for additional dwellings, which on £220,000 come to £12,900: 5% on the first £125,000 and 7% on the next £95,000 (HMRC; rates from Budget 2026 OOTLAR Annex A). In this example the net figure is about two percentage points below the gross one.
Mortgage interest, cash yield and leverage
Most buy-to-let purchases are part-funded with a mortgage. Mortgage interest is not deducted in a net rental yield, because the yield describes the property, not the way it is financed. But it decides how much cash you actually receive.
Continuing the illustration: with a 60% interest-only mortgage of £132,000 at a hypothetical 4.5% a year, interest is £5,940. Net income of £7,454 less £5,940 leaves £1,514 before tax. The investor put in £102,900 in cash: the £88,000 deposit, £12,900 of stamp duty land tax and £2,000 of fees. That is a pre-tax cash return of 1.5% on the money invested.
Borrowing magnifies the result in both directions. If the property rises in value, the gain on the investor’s cash is larger than it would be without a mortgage. If rents fall, voids lengthen or rates rise, the cash flow can turn negative, and a fall in house prices reduces the equity first. A rise of one percentage point in the mortgage rate in this example would add £1,320 a year to interest and remove most of the pre-tax cash.
The example uses an interest-only loan. With a repayment mortgage, part of each monthly payment reduces the debt. Those capital repayments are not a cost of the let, so they do not change the yield, and they are not deductible for tax. But they come out of the same rent, so the monthly cash left over is lower, even though the investor’s equity in the property grows each year. When comparing properties, keep the yield, the financing and the tax separate, then put them together at the end.
Tax on rental income from April 2027
Individual landlords pay income tax on their rental profit. Budget 2026, delivered on 28 October 2026, announced that the separate property income rates will be 24%, 44% and 49% from 6 April 2027, applying in England, Wales and Northern Ireland, with legislation in Finance Bill 2026-27 and with Scotland and Wales able to set their own (Budget 2026 OOTLAR, item 1.2; HMRC impact note). In 2026 to 2027 property income is still taxed at the main rates of 20%, 40% and 45% (OOTLAR Annex A).
Individuals cannot deduct mortgage interest. GOV.UK says claiming interest on property loans as an expense is something “You cannot do” as an individual landlord paying income tax (GOV.UK). Instead they receive a tax reduction. From 2027 to 2028 the legislation sets it at the property basic rate (ITTOIA 2005, section 274AA), which Budget 2026 announced will be 24% from 6 April 2027. HMRC’s Property Income Manual says companies are not affected by the restriction (HMRC, PIM2054).
| Illustration only, England | Basic-rate landlord | Higher-rate landlord |
|---|---|---|
| Net rental income before interest | £7,454 | £7,454 |
| Tax on £7,454 in 2027 to 2028 | £1,789 at 24% | £3,280 at 44% |
| Less credit: 24% of £5,940 interest | minus £1,426 | minus £1,426 |
| Tax payable | £363 | £1,854 |
| Cash after interest of £5,940 | £1,514 | £1,514 |
| Cash after tax | £1,151 | minus £340 |
| For comparison, tax in 2026 to 2027 | £303 | £1,794 |
The example assumes the whole profit falls in one tax band and that the credit is not capped. HMRC’s guidance explains that the credit is the basic-rate value of the lowest of finance costs, property profits and adjusted total income above the personal allowance (HMRC case studies). For the higher-rate landlord in this illustration, a positive net return becomes a negative cash return after tax. Small lettings have their own rule: GOV.UK says the first £1,000 of income from property rental is tax-free under the property allowance.
What ONS data show about rents and house prices
The ONS publishes the Price Index of Private Rents and the UK House Price Index together each month. Its release of 21 October 2026 reported that average UK private rent rose 3.8% to £1,406 a month in the 12 months to September 2026, while the average UK house price rose 0.9% to £273,000 in the year to August 2026, a provisional figure (ONS).
| Area | Average monthly rent, September 2026 | Annual rent change | Average house price, August 2026 | Annual price change |
|---|---|---|---|---|
| United Kingdom | £1,406 | 3.8% | £273,000 | 0.9% |
| England | £1,466 | 4.0% | £294,000 | 0.4% |
| Wales | £848 | 4.1% | £216,000 | 3.1% |
| Scotland | £1,011 | 0.7% | £198,000 | 2.9% |
| Northern Ireland | £879 (July 2026) | 1.7% | £202,000 (Q2 2026) | 9.2% |
Source: ONS, Private rent and house prices, UK: October 2026. The ONS notes that its rent index covers “all privately rented properties, including existing tenancies and newly advertised lets”, and that Scotland and Northern Ireland data are collected differently, so comparisons need care. Northern Ireland rents are for advertised new lets.
The gap between rent growth and price growth matters for yields. When rents rise faster than prices, as they did across the UK in the year to the latest data, yields on new purchases rise. That does not mean existing owners are better off: their return also depends on what happened to the value of the property.
The longer run tells a similar story. In the ONS datasets the average UK rent was £930 a month in August 2015 and £1,400 in August 2026, a rise of about 51%. Average UK house prices rose from £186,053 to £273,037 over the same months, about 47% (ONS PIPR; ONS UK HPI).
On those averages an indicative UK gross yield, calculated by TID as the August average rent multiplied by 12 and divided by the August average price, was 6.0% in August 2015 (£930 and £186,053), 5.6% in August 2020 (£1,026 and £220,163) and 6.2% in August 2026. These are TID calculations, not ONS statistics, and they share the caveats explained below.
Rental yield by region
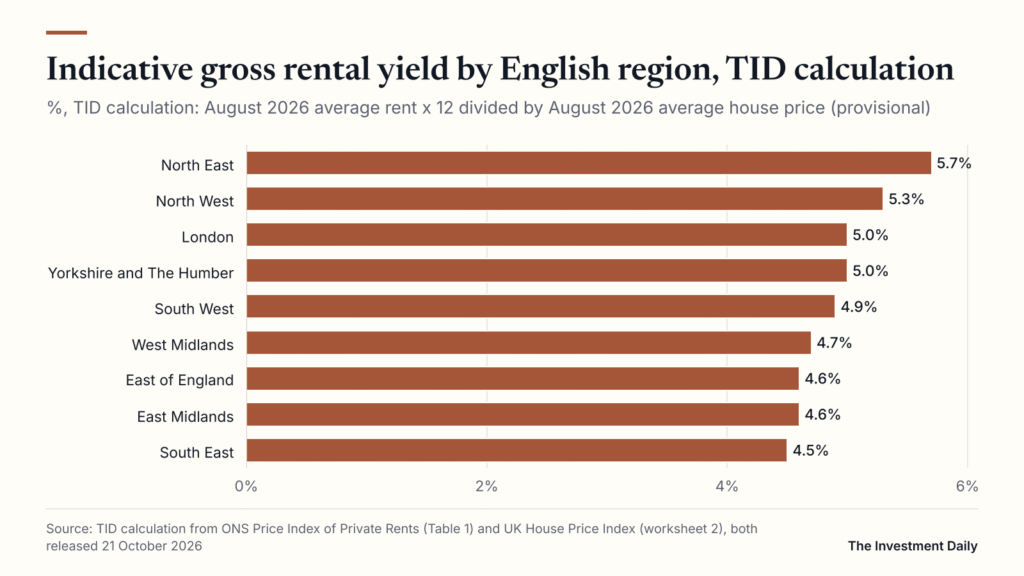
Dividing ONS average rents by ONS average house prices gives a rough, indicative yield for each English region. The method is a TID calculation, not an ONS statistic: the average monthly private rent for August 2026 from the Price Index of Private Rents (Table 1, rental price) is multiplied by 12 and divided by the average house price for August 2026 from the UK House Price Index (worksheet 2, a provisional figure), both from the ONS datasets released on 21 October 2026. August is used for both because it is the latest month the house price data cover.
The calculation has a large caveat: the average rent and the average price describe different groups of homes. The rent average covers the privately rented stock, while the price average covers homes sold, so the two are not like-for-like and the result is not the yield a buyer of an average-priced home would achieve.
| English region | Average rent, August 2026 | Average house price, August 2026 | Indicative gross yield (TID calculation) |
|---|---|---|---|
| North East | £788 | £165,640 | 5.7% |
| North West | £969 | £220,393 | 5.3% |
| London | £2,332 | £554,430 | 5.0% |
| Yorkshire and The Humber | £865 | £209,266 | 5.0% |
| South West | £1,245 | £304,139 | 4.9% |
| West Midlands | £982 | £250,731 | 4.7% |
| East of England | £1,289 | £337,848 | 4.6% |
| East Midlands | £922 | £241,955 | 4.6% |
| South East | £1,426 | £379,953 | 4.5% |
Sources: ONS Price Index of Private Rents dataset and ONS UK House Price Index dataset, both published 21 October 2026; yields are TID calculations (rent x 12 / price), rounded to one decimal place and ordered on unrounded values.
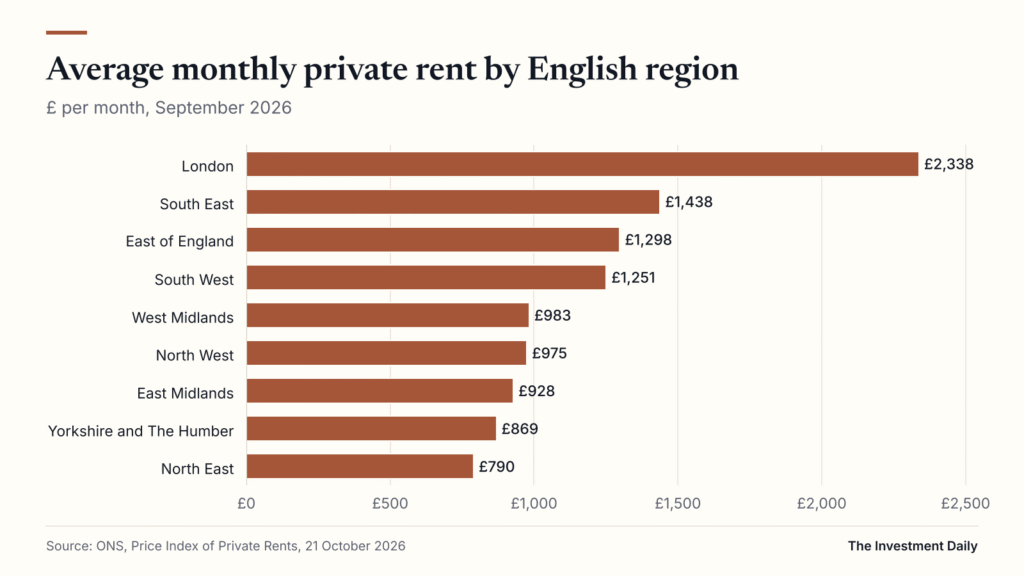
On this rough measure the North East has the highest yield and the South East the lowest. London’s rents are the highest in England at £2,338 a month in September 2026, but so are its prices, so its indicative yield of 5.0% sits in the middle. Regional averages hide large differences between towns, streets and property types, and the averages say nothing about net returns, which depend on the costs of each property.
Rental yield versus total return
A rental yield measures income only. The total return on a property adds the change in its value, and subtracts the costs of buying and selling. Over a holding period, total return equals net rental income plus or minus the change in value, less purchase and sale costs and tax, expressed against the money invested.
The table below follows the hypothetical £220,000 house over five years, for illustration only, assuming no mortgage, net rental income of £7,454 a year, selling costs of 1.5% and no tax. It shows how much the outcome depends on house prices at the end.
| Illustration only, five years | Price rises to £240,000 | Price unchanged at £220,000 | Price falls to £200,000 |
|---|---|---|---|
| Net rental income over five years | £37,270 | £37,270 | £37,270 |
| Sale price less 1.5% costs | £236,400 | £216,700 | £197,000 |
| Less total cost of £234,900 | plus £1,500 | minus £18,200 | minus £37,900 |
| Total return before tax | £38,770 | £19,070 | minus £630 |
The same rental yield produces a total return of almost £39,000 or a small loss, depending on what happens to house prices, because purchase and sale costs must be recovered first. Outside an ISA or pension, a gain on sale may also be subject to capital gains tax.
The two can point in opposite directions. The ONS reported that London house prices fell 2.2% in the year to August 2026 while London rents rose 3.5% in the year to September 2026 (ONS). A London landlord’s yield on cost rose, but the value of the property fell. In the North East, where the ONS reported the fastest regional house price growth at 3.2%, both moved the same way.
- Yield answers: what income does this produce now?
- Total return answers: what did I make overall, after costs and tax?
- Cash return answers: what cash do I receive on the money I put in?
Rental property is also illiquid and lumpy: you cannot sell a tenth of a house, and selling takes months. Some investors compare direct letting with listed property, such as real estate investment trusts, which pay out most of their rental profits and can be sold on an exchange. Our guide to property as an investment sets out the options.
Rental yield: common mistakes and what to check
- Comparing gross with net. Check which yield a listing or agent quotes. A gross figure leaves out every cost.
- Using the asking rent. Check comparable lets and allow for voids.
- Forgetting purchase costs. Stamp duty land tax at the higher rates and legal fees raise the true cost and lower the net yield on cost.
- Leaving out leasehold charges. Service charges and ground rent can take a large share of a flat’s rent.
- Treating net yield as cash. Mortgage interest and tax come after it. From 6 April 2027 individuals pay 24%, 44% or 49% on property income, with a 24% credit for interest.
- Ignoring licensing and regulation. Licences, safety checks and, in England, the rules for assured periodic tenancies, which GOV.UK says all assured shorthold tenancies became on 1 May 2026 (GOV.UK), affect costs and flexibility.
- Assuming rents only rise. ONS data show rent growth varying from 0.7% in Scotland to 5.7% in the North West in the year to September 2026.
Rental yield is a useful first filter and a poor final answer. Gross yield helps compare properties, net yield shows what the property earns, and cash return after mortgage interest and tax shows what the owner keeps. Property values and rents can fall, tenants can leave, and past performance is not a guide to future returns. For the tax side, see our buy-to-let and landlord tax section, and the Property desk for related guides.