
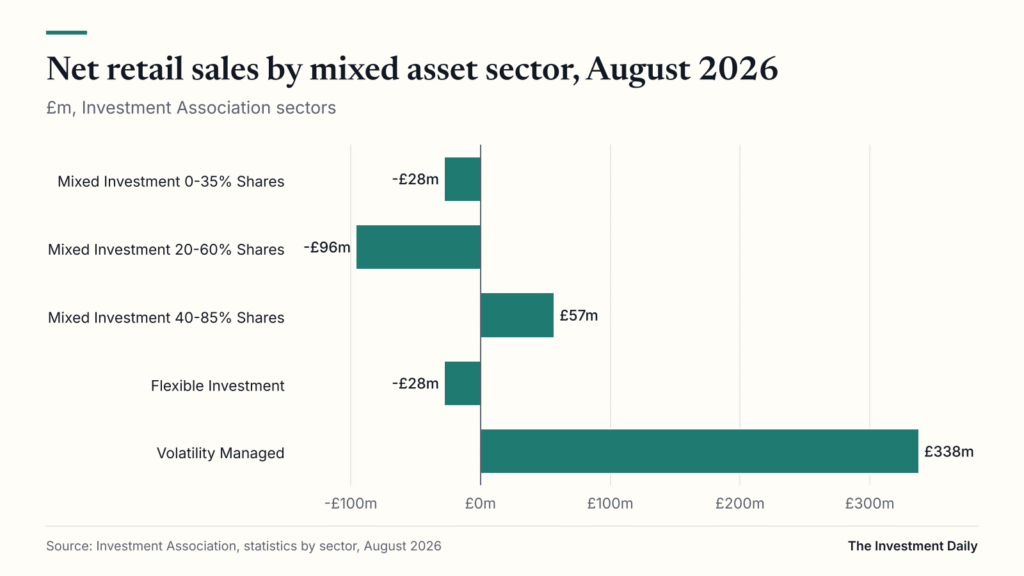
Multi asset funds hold a mix of shares, bonds, cash and sometimes property, infrastructure or commodities in a single fund, with the manager setting and maintaining the balance. The Investment Association (IA) groups many of them by the share held in company shares: 0% to 35%, 20% to 60% and 40% to 85%. In August 2026, its figures show the 40% to 85% sector took in £57m of net retail sales while the two lower-equity sectors had outflows (Investment Association). The equity share, the costs and the behaviour in a bad year for both shares and bonds are the points to check.
What multi asset funds are
A conventional fund invests in one asset class: UK shares, global bonds, property. Multi asset funds combine several in one portfolio. The manager decides the asset allocation, the split between shares, bonds, cash and other assets, and adjusts it over time within the limits set in the fund’s objectives.
The appeal is simplicity. One holding gives exposure to thousands of underlying securities across regions and asset types, and the fund does the rebalancing. The cost of that convenience is that you hand the most important decision, how much risk to take, to a fund label and a manager.
Multi asset funds are built in two main ways. Some hold shares and bonds directly. Many are a fund of funds, investing in other funds, which may be index funds, actively managed funds or exchange traded funds. The structure affects both the costs and how transparent the portfolio is.
- Shares provide most of the long-term growth potential and most of the short-term volatility.
- Bonds pay interest and have often, though not always, fallen less than shares in downturns.
- Cash and money market holdings provide stability and liquidity, with little growth after inflation.
- Other assets such as property, infrastructure, gold or absolute return strategies are added by some managers for diversification.
The Investment Association Mixed Investment sectors
The IA sorts UK-available funds into sectors so investors can make like-for-like comparisons, for example of performance and charges. Its website says there are 56 IA sectors and notes that funds in any sector “may offer a wide mix of asset, strategies and risk profiles” (Investment Association). A sector is a classification, not a rating.
Many multi asset funds sit in one of the three mixed investment sectors, named after the range of the fund that may be held in shares. Others sit in the Flexible Investment sector, which has a wider range, or the Volatility Managed sector described below.
| IA sector | Range held in shares (from sector name) | Net retail sales, August 2026 | Of which through ISAs |
|---|---|---|---|
| Mixed Investment 0-35% Shares | 0% to 35% | -£28m | -£11m |
| Mixed Investment 20-60% Shares | 20% to 60% | -£96m | -£35m |
| Mixed Investment 40-85% Shares | 40% to 85% | £57m | -£19m |
| Flexible Investment | Wider range | -£28m | -£37m |
| Volatility Managed | Managed to a volatility target | £338m | £49m |
Source: Investment Association, statistics by sector, August 2026. A negative figure means more money was withdrawn than invested.
What the definitions require
The sector rules go further than the equity range in the name. The IA’s current sector definitions set limits on equity exposure, which includes convertibles, and for two of the three mixed investment sectors a minimum held in fixed income and cash (Investment Association sector definitions).
| IA sector | Equity exposure | Fixed income and cash |
|---|---|---|
| Mixed Investment 0-35% Shares | Maximum 35%, no minimum | Minimum 45% investment grade fixed income and cash |
| Mixed Investment 20-60% Shares | Minimum 20%, maximum 60% | Minimum 30% fixed income and cash |
| Mixed Investment 40-85% Shares | Minimum 40%, maximum 85% | No minimum |
| Flexible Investment | No minimum or maximum; up to 100% at the manager’s discretion | No minimum; no minimum currency requirement |
| Volatility Managed | Asset selection at the manager’s discretion | Returns managed within specified volatility parameters |
Source: Investment Association, sector definitions, accessed 1 November 2026. The IA says “cash” can include current account cash, short-term fixed income investments and certificates of deposit. It also applies a “look-through” principle to securities that have the legal form of an equity, such as a listed investment trust or some listed ETFs, but invest in other assets such as property or commodities.
The definitions have changed over time. When the 0-35% sector started on 1 January 2012, the then Investment Management Association also required at least 80% in established market currencies, of which 40% had to be sterling (Investment Association). The definitions now published on the IA’s website contain no currency requirement for the three mixed investment sectors, which is one reason to read the current page rather than older summaries.
Two points follow. First, a fund in the 40% to 85% sector can hold either 40% or 85% in shares, and those two funds will behave very differently. Second, the sector says little about which shares or which bonds the fund holds. The mixed investment sectors work as a starting filter; the fund’s own asset allocation shows what it actually holds.
Risk-graded ranges and volatility managed funds
Fund groups often sell multi asset funds as a numbered or named range, for example from 1 to 5 or from “cautious” to “adventurous”. Some ranges are designed to sit within the mixed investment sectors; others are not. Each step up holds more in shares and less in bonds and cash. There is no common industry scale, so one firm’s “balanced” fund can hold a different share of equities from another’s.
The IA’s Volatility Managed sector was created for a different approach. The IA launched it on 3 April 2017 to help investors find funds managed to a volatility outcome rather than a fixed asset mix, and its guide notes that a target might be expressed “as a percentage of Global Equity volatility” (Investment Association). The IA’s sector definition adds that “Outcomes are not guaranteed”, that a fund may form part of a suite operating across a risk spectrum set out in terms of volatility, and that because funds use different benchmarks and timeframes, performance comparisons across the whole sector are not valid (Investment Association).
A volatility managed fund changes its asset allocation to keep its expected ups and downs within a band. That keeps the level of risk steady but means the mix of assets moves around. Two volatility managed funds with similar targets can hold quite different portfolios.
Matching a fund to a risk profile
Platforms and advisers often ask questions to place an investor in a risk profile, such as cautious, balanced or adventurous, then map that to a fund in a range. The mapping is only as good as the questions and the fund behind the label. A risk profile describes how much loss you could bear and for how long; the fund’s asset allocation describes how much loss it could produce.
For illustration only, an investor who needs the money within three years may find that a fund holding 80% in shares does not match a cautious risk profile, whatever the range calls it. Time horizon, other savings and the ability to leave money invested through a fall all matter. A regulated adviser can assess this formally; a fact sheet cannot.
- Check how the range defines each risk level, and whether it is by asset mix or by volatility.
- Compare the maximum and typical share of equities, not just the label.
- Look at how the fund behaved in a year when both shares and bonds fell.
How rebalancing works in multi asset funds
Markets move the mix. If shares rise faster than bonds, a fund that started at 60% shares drifts above that level and takes more risk than intended. Rebalancing means selling some of what has risen and buying what has lagged, to restore the target asset allocation.
| Illustration: £10,000 at a 60/40 target | Shares | Bonds | Total | Share of equities |
|---|---|---|---|---|
| Start | £6,000 | £4,000 | £10,000 | 60.0% |
| After shares +20%, bonds -5% | £7,200 | £3,800 | £11,000 | 65.5% |
| After rebalancing | £6,600 | £4,400 | £11,000 | 60.0% |
In the illustration the fund sells £600 of shares and buys £600 of bonds. Inside a fund, those trades do not create a capital gains tax bill for you. If you ran the same portfolio yourself in a general investment account, each sale could be a disposal for capital gains tax.
What drift does without rebalancing
Without rebalancing, a portfolio tends to drift towards whichever asset has risen most. For illustration only, if shares returned 8% a year and bonds 3% for ten years, a mix that started at 60/40 would end at roughly 71/29. The risk profile of the holding would have changed without any decision being made. Preventing that drift is one of the jobs these funds do.
Funds rebalance in different ways: on a calendar, when the mix drifts beyond a band, or at the manager’s discretion. Rebalancing controls risk; it does not guarantee a better return, and in a long rising market it means selling some of the strongest performers.
Active vs passive multi asset funds
Passive versions hold index funds or index-tracking securities in a largely fixed mix and rebalance back to it. Active versions give the manager more freedom: to change the asset allocation tactically, to pick individual securities or active funds, and to add alternative assets.
| Feature | Passive multi asset | Active multi asset |
|---|---|---|
| Mix of assets | Set, with periodic rebalancing | Varies with the manager’s views |
| Underlying holdings | Index funds or index securities | Active funds, direct holdings, alternatives |
| Costs | Usually lower ongoing charges | Usually higher; may include underlying fund costs |
| Main risk | Owning the market, including expensive parts of it | The manager’s decisions may lag the market |
| Transparency | High: allocation published and stable | Varies: allocation can change between fact sheets |
Neither approach is better in general. Passive funds still involve choices, because someone decides the split between UK and overseas shares, which bond indices to use and whether to hedge currency. For background on index funds, see index funds for UK investors and global tracker funds.
Costs of multi asset funds
The headline cost is the ongoing charges figure, expressed as a percentage of the fund each year. Ongoing charges vary widely with the approach, and in a fund of funds they can include the charges of the underlying funds as well as the top-level manager’s fee. Platform fees, dealing costs and transaction costs inside the fund come on top.
The FCA’s new rules for consumer composite investments, set out in policy statement PS25/20 in December 2025, make the ongoing charges figure the headline cost measure. Explicit transaction costs and one-off costs “do not need to be aggregated with ongoing costs, but they will need to be disclosed”, and where a fund holds investment trusts, the FCA will not require those trusts’ costs to be added to the investing fund’s ongoing costs figure, though they must be disclosed clearly. The regime applies in full from 8 June 2027 (FCA).
Layers of cost in a fund of funds
A fund of funds charges its own fee and also bears the charges of the funds it holds. For illustration only, a top-level fee of 0.5% plus underlying funds charging an average of 0.4% gives a combined cost of about 0.9% a year. Check whether the published ongoing charges for a fund of funds include those underlying costs, and look for the separately disclosed transaction costs.
A direct portfolio avoids the second layer but may hold fewer securities. Neither structure is cheaper by definition: a fund of funds built from low-cost index funds can cost less than a direct portfolio with an expensive manager.
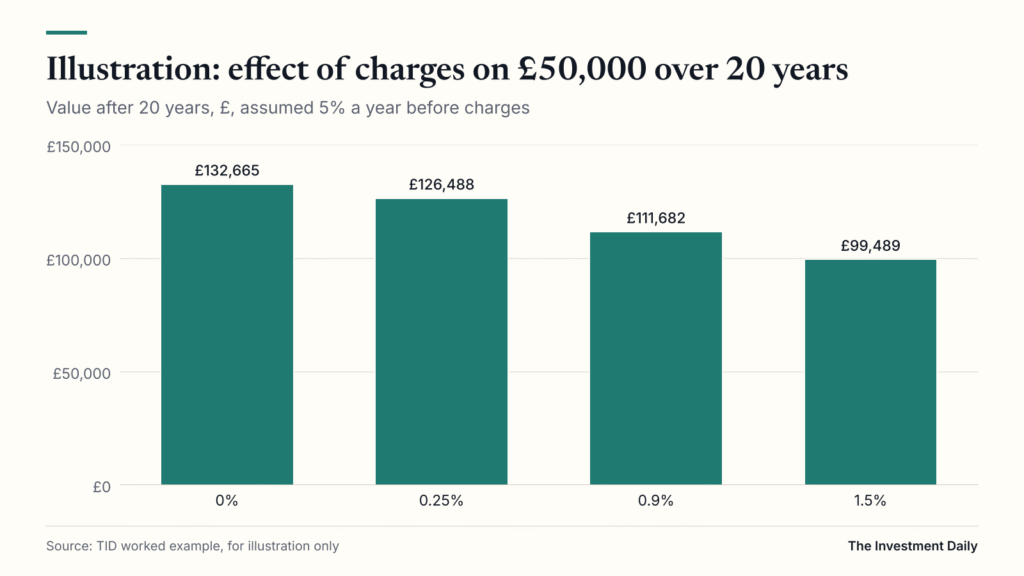
Charges compound against you. The table assumes £50,000 invested for 20 years at 5% a year before charges, for illustration only.
| Total annual charges (illustration) | Value after 20 years | Cost compared with no charges |
|---|---|---|
| 0% | £132,665 | £0 |
| 0.25% | £126,488 | £6,177 |
| 0.9% | £111,682 | £20,983 |
| 1.5% | £99,489 | £33,175 |
How to read a fact sheet for multi asset funds
A fact sheet is a summary, usually monthly, of what the fund holds and how it has done. With multi asset funds, the allocation matters more than the name, so read it before anything else.
- Objective and sector. What the fund aims to do, over what period, and which IA sector it sits in.
- Asset allocation. The percentages in shares, bonds, cash and other assets, and the regional split of the shares.
- Bond detail. Government or corporate, investment grade or high yield, and average duration, which measures sensitivity to interest rates.
- Currency. How much is in sterling or hedged to sterling, and how much is exposed to other currencies.
- Top holdings. Where the fund invests in other funds, these are the underlying funds.
- Costs. Ongoing charges, and whether they include underlying fund costs.
- Performance. Returns over several periods against the sector average or a stated benchmark. Past performance is not a guide to future returns.
- Share class. Accumulation or income, and the ISIN.
Compare the fact sheet with the key information document or product summary, which sets out the risks and costs in a standard way. Under PS25/20, firms could start using the new product summary from 6 April 2026 (FCA).
Flows into multi asset funds and tax
The IA’s monthly figures show which way investors have been moving between the mixed investment sectors and the rest of the market. In May 2026, it reported net retail inflows of £2.5bn across all funds, of which mixed asset funds attracted £1.67bn; the Mixed Investment 40-85% Shares sector recorded a sixth consecutive month of inflows, with £434m, and the Volatility Managed sector took in £433.1m. Industry funds under management were £1.7 trillion at the end of May 2026 (Investment Association).
By August 2026 the picture was mixed: the Volatility Managed sector took in £338m and the 40% to 85% sector £57m, while the 0% to 35% and 20% to 60% sectors had net outflows of £28m and £96m (Investment Association). Flows show what investors bought, not what will perform.
Tax outside an ISA or pension
Inside a stocks and shares ISA or a pension, distributions and gains are not taxed; GOV.UK lists “unit trusts and investment funds” among the investments a stocks and shares ISA can hold (GOV.UK). Outside, the type of distribution matters. HMRC says a fund can pay interest distributions only if the market value of its qualifying investments, broadly bonds and cash, “exceeds 60% of all its investments” throughout the period; otherwise income is paid as dividends (HMRC; HMRC).
A cautious fund with more than 60% in bonds and cash may therefore pay interest. Budget 2026 raises the savings income rates from 20%, 40% and 45% to 24%, 44% and 49% from 6 April 2027, with the Personal Savings Allowance unchanged at £1,000 or £500. Dividend rates stay at 10.75%, 35.75% and 39.35%, with a £500 allowance (Annex A; OOTLAR item 1.1). See tax-efficient investing in the UK.
Risks of multi asset funds
Diversification reduces some risks but does not remove them. These funds can and do fall in value, and you may get back less than you invest.
- Shares and bonds falling together. Diversification relies on assets not all falling at once. When interest rates rise sharply, bond prices can fall at the same time as shares.
- Inflation. Cautious funds with large bond and cash holdings may struggle to keep pace with inflation; CPI rose 3.5% in the 12 months to September 2026, according to the ONS (ONS).
- Label risk. Names such as “balanced” or “cautious” are not standard, and sector ranges are wide.
- Manager risk. In active funds, decisions on the mix and on individual holdings can go wrong.
- Currency risk. Unhedged overseas holdings rise and fall with exchange rates.
- Cost drag. Layers of charges reduce returns every year.
A bad year for both shares and bonds
For illustration only, take a fund holding 60% in shares and 40% in bonds. If shares fell 15% and bonds fell 10% in the same year, the fund would lose about 13%, before charges. A fund holding 30% in shares would lose about 11.5% in the same conditions: less, but not much less. Cautious labels describe a lower share of equities, not protection from loss.
The Financial Services Compensation Scheme protects against the failure of an authorised firm, up to £85,000 per eligible person per firm, not against falls in value: “We can’t accept any claims that are for poor investment performance” (FSCS).
What to check before choosing multi asset funds
Multi asset funds package the asset allocation decision into one product. That can make investing simpler, but the label tells you less than the fact sheet. The main questions are the same whichever fund group you look at.
- What share of the fund is in equities now, and the maximum it can hold.
- Which IA sector it sits in, and how its allocation compares with the mixed investment sectors’ ranges.
- Whether it is passive or active, and a direct portfolio or a fund of funds.
- Whether the fund’s risk level matches your own risk profile and time horizon.
- The ongoing charges and what they include.
- How and how often it rebalances.
- How it behaved in falling markets, while remembering that past performance is not a guide to the future.
- Whether it pays dividends or interest, and which wrapper you will hold it in.
For how a mixed fund fits alongside other holdings, see how to build a diversified portfolio and the Funds and ETFs desk.